Hospital admissions comparators
Hospital admissions dashboards:
- Trends
- Comparator
- Referral patterns
- Occupancy
- Patient demographics
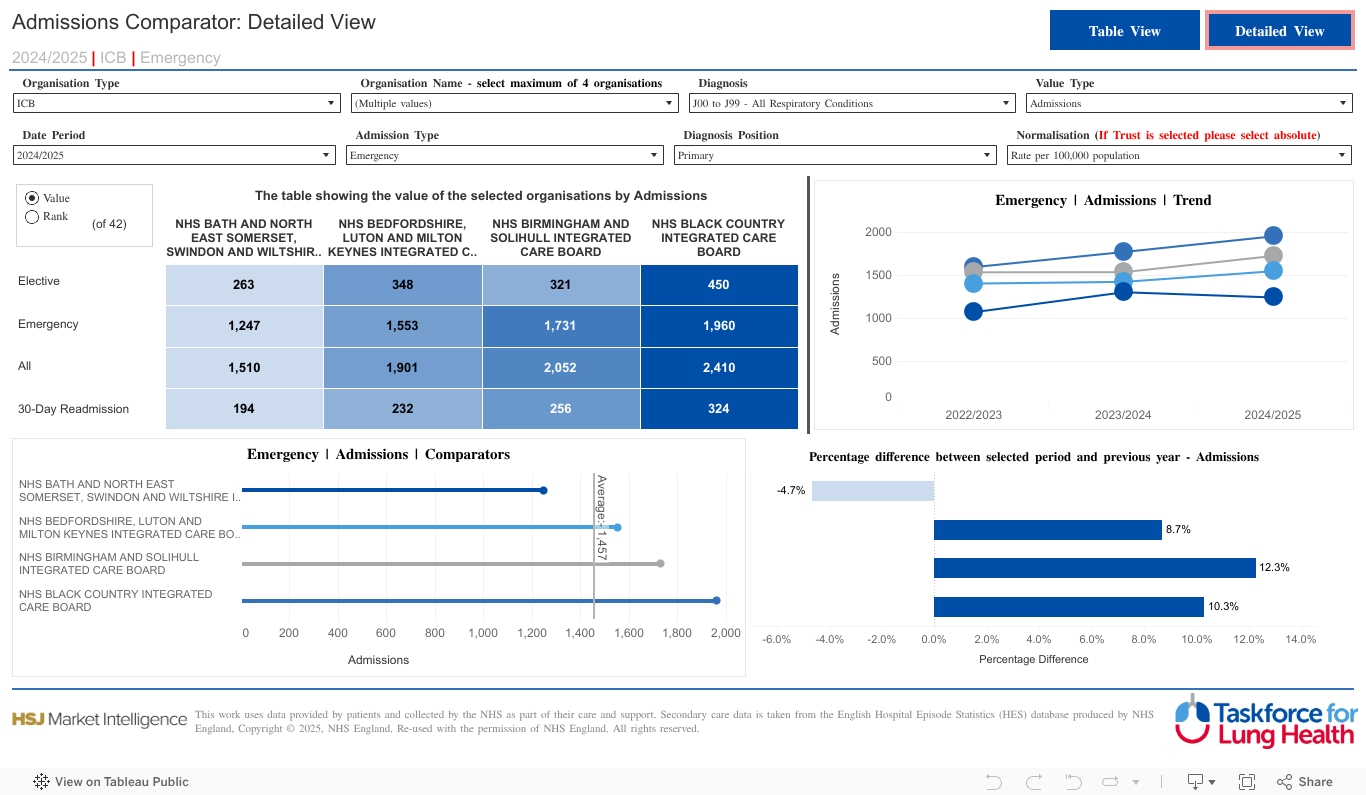
The comparator dashboard allows you to compare respiratory hospital admissions data across different organisations.
Please reference use of the Taskforce data dashboards, and if you have any comments or questions please contact taskforce@asthmaandlung.org.uk.
How to use this dashboard
- The Admission Comparator dashboard allows you to compare inpatient activity for your selected organisations and filter options, and how they compare with the national average
- You can view this data in two formats, selected by using the Table View/ Detailed View buttons at the top righthand side of the page.
- There are 4 visualisations within the Detailed View, the content of which is determined by the drop-down boxes at the top of the dashboard
- When comparing areas, we recommend using Normalisation filter Rate per 100,000 (default) rather than Absolute values (see drop-down box Normalisation).
- The detailed view shows data for each of the last 3 years (see drop down box Date period) nationally or for specific areas or organisation types (e.g. Region, ICS, PCN) (see drop down box Organisation type)
- When Region, ICB or PCN is selected in Organisation type, it is possible to compare several organisations of that type. We recommend selecting no more than 4 organisations to compare at a time.
- Data can be viewed for “All respiratory” conditions or for six individual respiratory conditions – Influenza, Pneumonia, COPD (Chronic Obstructive Pulmonary Disease), Asthma, Bronchiectasis and Interstitial Lung Disease (see drop-down box Diagnosis)
- Data is available on admissions, patients, cost and bed days (see drop down box Value Type)
- The admission type drop-down box adjusts the top lefthand and bottom two visualisations to show the type of admission being shown (e.g. elective, emergency, readmissions)
- The Diagnosis position drop-down box allows the data to be viewed for All, Primary or Secondary diagnosis. A primary diagnosis is the diagnosis which brought a patient into hospital while a secondary diagnosis is an existing health condition that is not the main reason for the current healthcare (i.e. underlying chronic condition).
- It is possible to view the data in the top lefthand visualisation either by value or by how the selected organisation or area ranks against the other organisations or areas in that grouping (e.g. other ICBs) (Select between Value and Rank on lefthand side of visualisation).Admissions – number of spells of care, total continuous stay of a patient using a hospital bed after admission to hospital, can be made up of multiple episodes, including critical care.
- Activity table shows Value Type selected by Admission Type across the Organisations selected, can show by value (either Absolute numbers or Rate per 100,000 as per Normalisation filter) or by rank.
- Colour gradient reflects magnitude of Value Type selected across the Organisations selected (from lowest values as lightest colours to highest values as darkest colours).
- 3 year trend chart shows Organisations selected using same colours as activity table.
- Activity bar chart shows Value Type for Date Period and Organisations selected compared to national average.
- Activity change chart shows difference in Value Type selected compared to previous year for Organisations selected.
- Recommend using Table View to compare all areas by date period, diagnosis, admission type and normalisation.
- Note in Table View mean length of stay and cost per patient (£) parameters only visible when Normalisation filter Absolute selected.
Unique filters
1) Date type
2) Admission Type – Elective, Emergency (Default), All, 30-Day Readmission
3) Activity or Rank Control
a) Activity = parameter selected
b) Rank = rank of area for parameter selected
Key definitions
- Admissions – number of spells of care, total continuous stay of a patient using a hospital bed after admission to hospital, can be made up of multiple episodes, including critical care.
- Bed days – total duration of all spells of care, duration between admission date and final episode discharge date.
- Cost – cost of entire spell of care, calculated using national tariff cost for the spell, not cost of procedure or diagnosis but reimbursement given to provider from ICS. NHS Payment scheme can be found here.
- Diagnosis Position – Primary diagnosis is the diagnosis which brought a patient into hospital Secondary diagnosis position is an existing health condition that is not the main reason for the current healthcare (i.e. underlying chronic condition). All diagnosis position is where the selected diagnosis has been coded in any position within a hospital spell.
- Elective – the admission to hospital for treatment is from the waiting list.
- Emergency – non-elective admission, the admission was unpredictable/unplanned and at short notice because of clinical need.
- Episode – time a patient spends under continuous care of a consultant/healthcare professional. Multiple episodes make up a spell, i.e. an admission.
- Patients – number of distinct patients, a patient can come into hospital multiple times for the same diagnosis.
- Spell – total time a patient spends in hospital/under the care of the physician(s), each spell can have one or more episodes.
- 30-day re-admission – emergency (non-elective) admission within 30 days of a previous admission
About the data source
Hospital Episode Statistics (HES) Admitted Patient Care (APC) is an NHS data set comprising details of all admissions at NHS hospitals in England. Each record in HES includes a wide range of information including details of the patient (age, gender, geographic details), when they were treated and what they were treated for. HES is sourced from the Secondary Uses Service (SUS) database, which is collected from hospitals’ patient administration systems on a monthly basis at record level. The quality of HES data is the responsibility of the NHS providers who submit the data to Secondary Uses Service (SUS). These data are required to be accurate to enable them to be correctly paid for the activity they undertake.
Read the data disclaimer.