Inequalities in respiratory disease admissions
Health inequalities dashboards:
- National deprivation
- Integrated Care Board (ICB) deprivation
- Inequalities in respiratory disease admissions
This dashboard allows you to analyse hospitalisation rates in Asthma and COPD as a proportion of prevalence at a system (ICB) and local level and how this relates to deprivation.
Please reference use of the Taskforce data dashboards, and if you have any comments or questions please contact taskforce@asthmaandlung.org.uk.
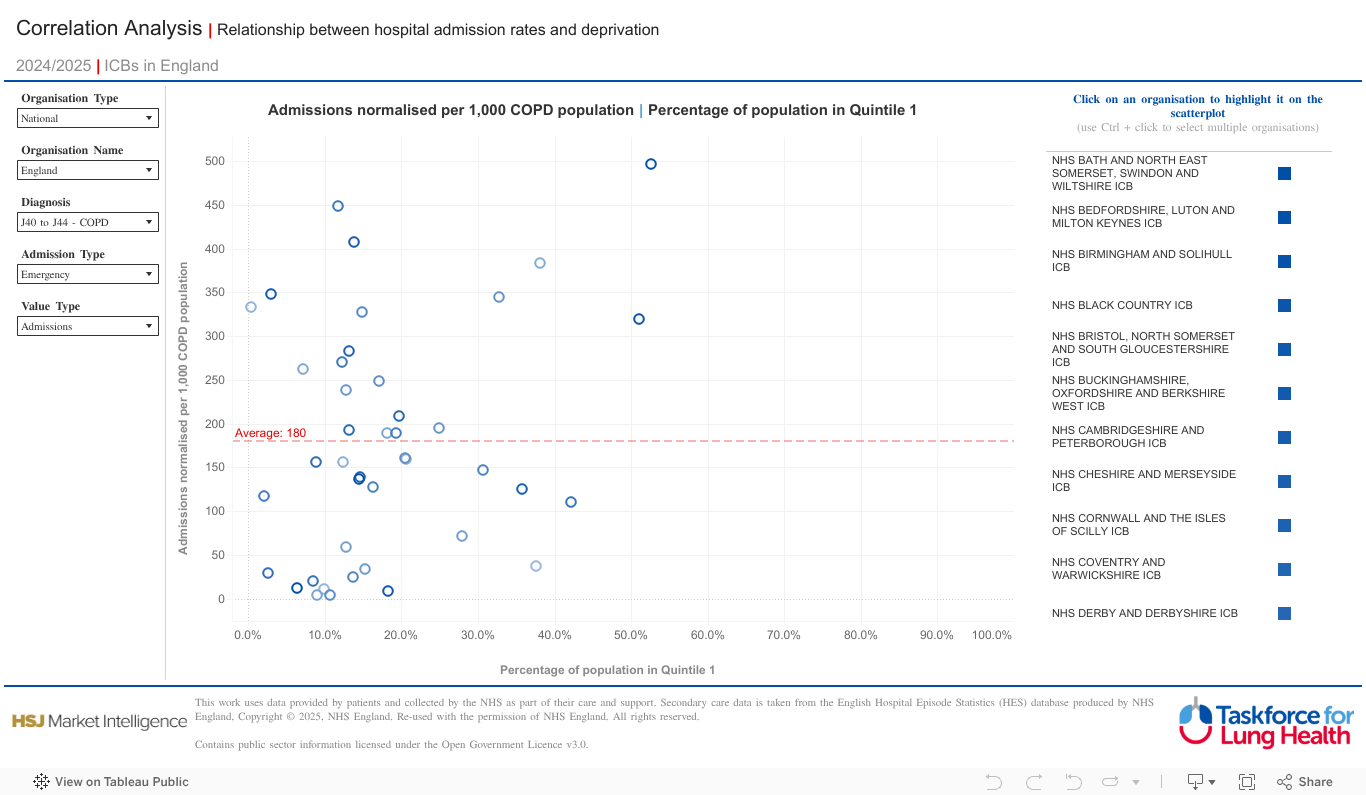
How to use this dashboard
- The Correlation Analysis dashboard allows you to explore the relationship between Hospital Episode Statistics (HES) inpatient admissions and deprivation
- You can compare inpatient admissions for asthma or COPD (normalised by the QOF population for the relevant disease) with the percentage of the population in quintile 1 (the most deprived 20% of the population) and use the filters to view different metrics and admission types
- You can choose to compare ICBs within England, or PCNs within a selected ICB
- Each ICB or PCN is represented by a blue-outlined circle, while the red dotted line shows the average of all ICBs or PCNs. Those below the line are doing better than average while those above the line are doing worse than average
- The further to right on the graph the circle appears, the higher the proportion of people living in that area are in the most deprived 20% of the population
- The higher up on the graph, the more Value Type filter selected i.e. if Admissions was selected, the more admissions there are
Unique filters
- Admission Type – Emergency (Default), 30-Day Readmission
Key definitions
- Emergency – non-elective admission, the admission was unpredictable/unplanned and at short notice because of clinical need.
- 30-day re-admission – emergency (non-elective) admission within 30 days of a previous admission.
About the data source
Hospital Episode Statistics (HES) Admitted Patient Care (APC), is an NHS data set comprising details of all admissions at NHS hospitals in England. Each record in HES includes a wide range of information including details of the patient (age, gender, geographic details), when they were treated and what they were treated for. HES is sourced from the Secondary Uses Service (SUS) database, which is collected from hospitals’ patient administration systems on a monthly basis at record level. The quality of HES data is the responsibility of the NHS providers who submit the data to Secondary Uses Service (SUS). These data are required to be accurate to enable them to be correctly paid for the activity they undertake.
The Index of Multiple Deprivation (IMD) is produced by combining information from the seven domains of the Indices of Deprivation: Income Deprivation; Employment Deprivation; Education, Skills and Training Deprivation; Health Deprivation and Disability; Crime; Barriers to Housing and Services; Living Environment Deprivation. IMD is the official measure of relative deprivation for small areas (Lower-layer Super Output Areas) in England. Each area has a deprivation score and a deprivation rank: the larger the score, the more deprived the area and the lower its rank. Deprivation quintiles are created by converting the rankings into 5 equal sections, with Quintile 1 representing the most deprived and Quintile 5 the least deprived
The Quality and Outcomes Framework (QOF) is a voluntary annual reward and incentive programme for all GP practices in England, detailing practice achievement results and is designed to reward good practice. The QOF contains five main components, known as domains. The five domains are: Clinical; Public Health and Public Health – Additional Services, Public Health – Vaccination and Immunisation and Quality Improvement. Each domain consists of a set of achievement measures, known as indicators, against which practices score points according to their level of achievement. The QOF gives an indication of the overall achievement of a practice through a points system. Practices aim to deliver high quality care across a range of areas for which they score points. The QOF helps practices compare the delivery and quality of care currently provided against the achievements of previous years. Ultimately, the aim is to improve standards of care by assessing and benchmarking the quality-of-care patients receive.
Read the data disclaimer.