Integrated Care Board (ICB) deprivation
Health inequalities dashboards:
- National deprivation
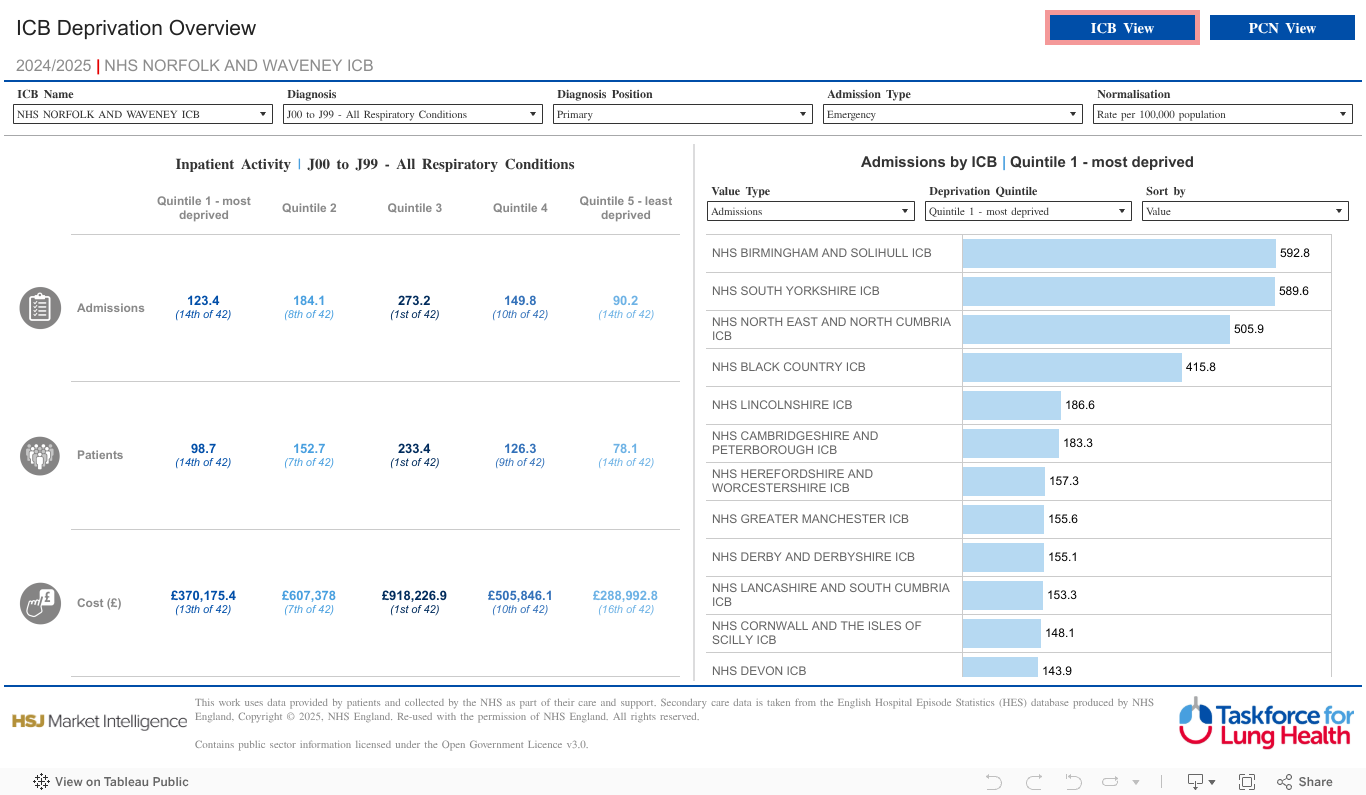
- Integrated Care Board (ICB) deprivation
- Inequalities in respiratory disease admissions
Analyse respiratory admissions across different deprivation quintiles within an ICB and at the Primary Care Network (PCN) level in order to understand and address local challenges around managing respiratory disease.
Note buttons at the top right hand side of the data: ICB view, PCN view
Please reference use of the Taskforce data dashboards, and if you have any comments or questions please contact taskforce@asthmaandlung.org.uk.
How to use this dashboard
- The Integrated Care Board (ICB) Dashboard combines inpatient activity data and data from the Index of Multiple Deprivation. You can filter data by ICBs or PCNs so you can compare respiratory admissions and costs across different areas.
- The default shows admission data filtered by ICB, you can filter data by Primary Care Networks (PCN) in your selected ICB by choosing ‘PCN View’ button on the top left of the page.
On both the PCN and ICB dashboards, you can filter data by:
Diagnosis i.e. condition
Diagnosis position i.e. where someone received their diagnosis
Admission type i.e. Elective, emergency and 30-day readmission - When comparing areas, we recommend using the Normalisation filter Rate per 100,000 (default)
The numbers in brackets (i.e. 20th of 42) show ranking of ICBs or PCNs. Rank 1 is the highest number of admissions or the greatest cost associated with respiratory inpatient activity - The table on the left in the ‘ICB View’ and in the centre of the ‘PCN view’ provides data on admissions, number of patients, admissions per patients, costs, cost per patients and mean length of stay.
- We recommend using Absolute numbers in Normalisation filter for left hand side of the dashboard to find patient activity data for individual ICBs or PCNs.
- The table on the left in the ‘PCN’ View a provides demographic data for the selected PCN.
- On both the ICB and PCN dashboard you can modify the visualisation on the bar chart on the right by filtering data by deprivation quintile.
- You can also modify the data by changing value type. You can select to modify the bar chart by selecting admissions, costs or number of patients in the drop box ‘Value Type’.
Unique filter
- Admission Type – All, Elective, Emergency (default), 30-Day Readmission
- Deprivation Quintile – 1 (most deprived 20%), 2, 3, 4, 5 (least deprived 20%)
Key definitions
- Diagnosis Position – Primary diagnosis is the diagnosis which brought a patient into hospital. Secondary diagnosis position is an existing health condition that is not the main reason for the current healthcare (i.e. underlying chronic condition). All diagnosis position is where the selected diagnosis has been coded in any position within a hospital spell.
- Elective – the admission to hospital for treatment is from the waiting list.
- Emergency – non-elective admission, the admission was unpredictable/unplanned and at short notice because of clinical need.
- 30-day re-admission – emergency (non-elective) admission within 30 days of a previous admission.
About the data source
Hospital Episode Statistics (HES) Admitted Patient Care (APC) is an NHS data set comprising details of all admissions at NHS hospitals in England. Each record in HES includes a wide range of information including details of the patient (age, gender, geographic details), when they were treated and what they were treated for. HES is sourced from the Secondary Uses Service (SUS) database, which is collected from hospitals’ patient administration systems on a monthly basis at record level. The quality of HES data is the responsibility of the NHS providers who submit the data to Secondary Uses Service (SUS). These data are required to be accurate to enable them to be correctly paid for the activity they undertake.
The Index of Multiple Deprivation (IMD) is produced by combining information from the seven domains of the Indices of Deprivation: Income Deprivation; Employment Deprivation; Education, Skills and Training Deprivation; Health Deprivation and Disability; Crime; Barriers to Housing and Services; Living Environment Deprivation. IMD is the official measure of relative deprivation for small areas (Lower-layer Super Output Areas) in England. Each area has a deprivation score and a deprivation rank: the larger the score, the more deprived the area and the lower its rank. Deprivation quintiles are created by converting the rankings into 5 equal sections, with Quintile 1 representing the most deprived and Quintile 5 the least deprived.
Read the data disclaimer.