Outpatient performance trends
Outpatient performance dashboards:
- Trends
- Comparator
- Referral routes
The outpatient trend dashboard allows you to analyse respiratory medicine outpatient performance over time for a given organisation.
Please reference use of the Taskforce data dashboards, and if you have any comments or questions please contact taskforce@asthmaandlung.org.uk.
How to use this data
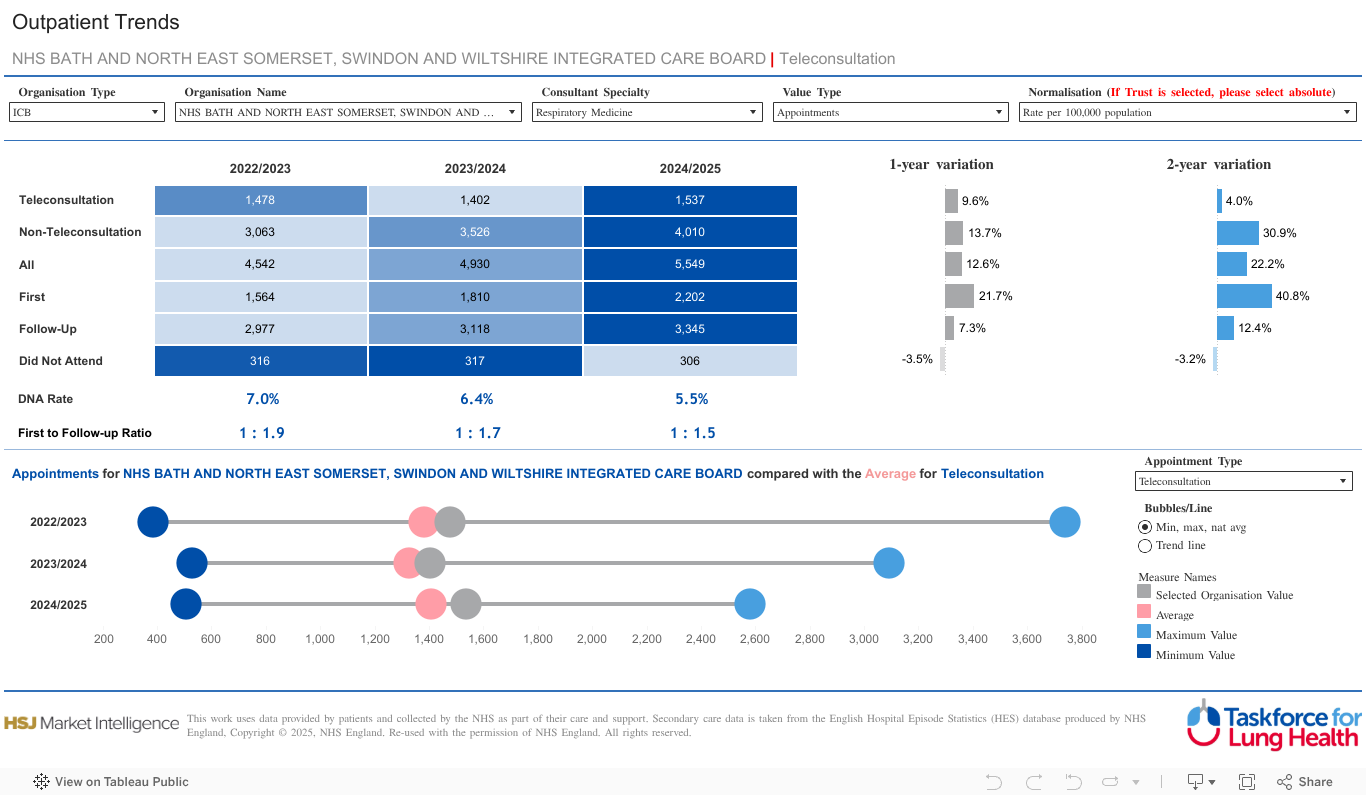
- The Outpatient Trends dashboard shows trends in outpatient activity over time for your chosen specialty (Respiratory Medicine or Paediatric Respiratory Medicine), organisation and filter options, and how it compares with the average.
- There are two linked visualisations in this dashboard. The drop-down boxes at the top determine what is shown in both visualisations.
- The top visualisation shows Value Type selected by Normalisation selected (raw numbers or rates) across outpatient appointment types as well as the change compared to 1 and 2 years ago.
- In the bottom visualisation, maximum and minimum values refer to the organisations with the highest and lowest values respectively so use this to see how one organisation compares to the range (with Normalisation filter Rate per 100,000 selected)
- We recommend using the Trend Line option in bottom visualisation to see trends over time for selected Organisation compared with the average (with Normalisation filter Absolute selected).
- Please note that the Admission Type filter for visualisation at the bottom of the dashboard is separate and independent from those for the other visualisations, but the filters at the top of the visualisation determine what is shown in the bottom visualisation.
- Additional points to note
- Changing the filters within the second visualisation does not make changes to the first.
- Colour gradients have been used to reflect different magnitudes of Value Type (e.g. appointments, patient, cost) selected across the years (with the lowest values in the lightest colours to the highest values in the darkest colours).
- Use Normalisation filter Rate per 100,000 (default) to compare areas. You may need to scroll to the right within the dashboard to see this.
Unique filters
- Consultant Specialty – choose between Respiratory Medicine and Paediatric Respiratory Medicine.
Key definitions
- Appointments – number of outpatient appointments.
- Did Not Attend – appointments where patient did not attend appointment.
- Did Not Attend (DNA) rate – the percentage of outpatient appointments, which resulted in the patient not attending the appointment out of all outpatient appointments.
- First appointment – the first respiratory medicine specialty appointment for that patient.
- Follow-up appointment – the follow up appointments for a patient in respiratory medicine.
- First to follow-up ratio – the ratio between first and follow-up appointments weighted to first appointments i.e. how many follow-up appointments for every new referral.
- Non-teleconsultation – face- to- face appointment.
- Teleconsultation – telehealth appointment e.g. phone or video call.
About the data source
Hospital Episode Statistics (HES) Outpatient Activity is an NHS data set comprising details of all outpatient appointments at NHS hospitals in England and includes data about hospital outpatient appointments by patient demographics, attendance types, operations, specialty, and provider level analysis. HES is sourced from the Secondary Uses Service (SUS) database, which is collected from hospitals’ patient administration systems on a monthly basis at record level. The quality of HES data is the responsibility of the NHS providers who submit the data to Secondary Uses Service (SUS). These data are required to be accurate to enable them to be correctly paid for the activity they undertake.
Read the data disclaimer.