Waiting list insights
The waiting list insights dashboard provides insights into waiting lists for patients in respiratory medicine, looking at both complete and incomplete pathways, with and without a decision to admit, as well as waits under 18 weeks, over 18 weeks and over 52 weeks.
Please reference use of the Taskforce data dashboards, and if you have any comments or questions please contact taskforce@asthmaandlung.org.uk.
How to use this dashboard
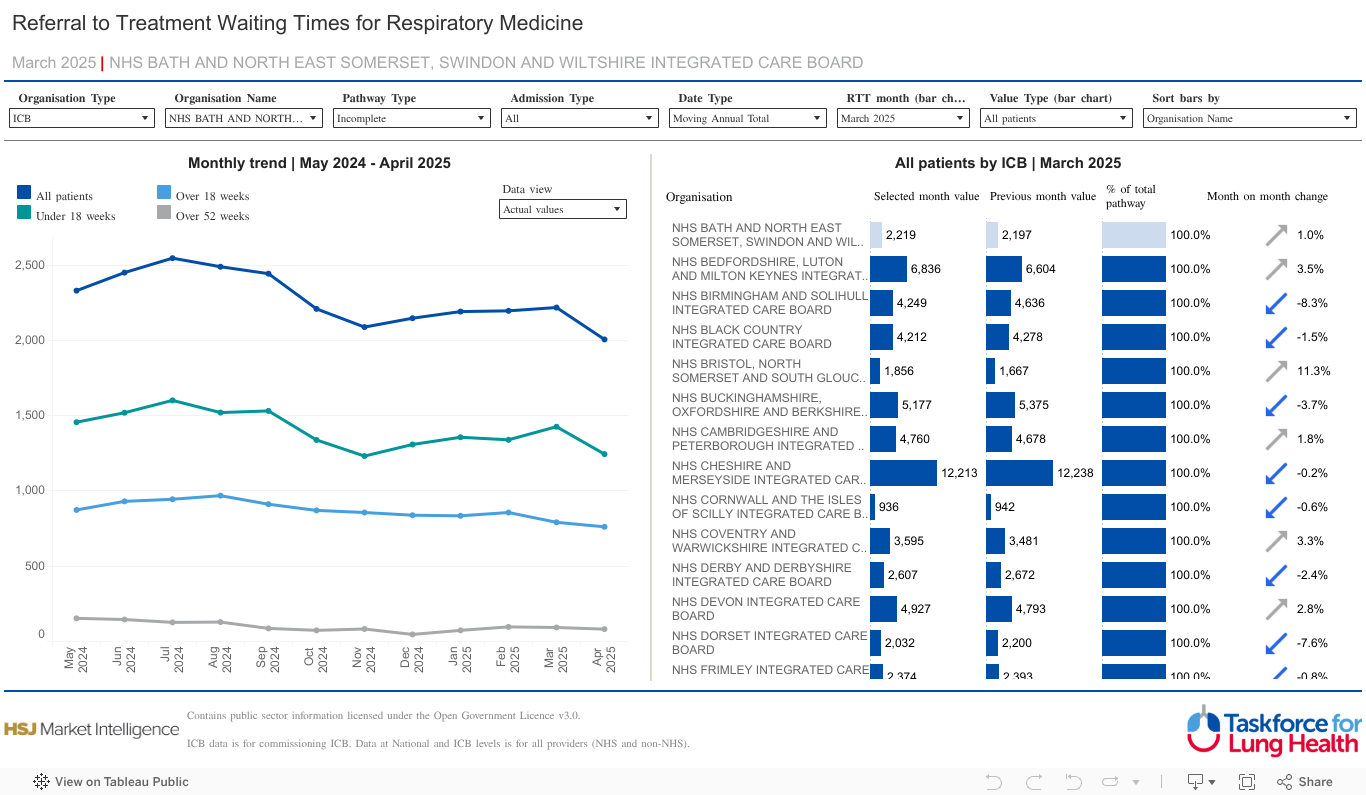
- The RTT Waiting Times dashboard allows you to explore waiting times from referral to elective treatment (consultant-led Referral to Treatment (RTT)) for Respiratory Medicine
- You can view monthly trend data for your selected organisation and year, and also compare data across organisations for a chosen month
- In most cases, selecting Pathway Type Incomplete will be preferred as this shows patients still waiting (default option)
- The graph shows the percentage of patients who have waited fewer than 18 weeks for treatment, which is the NHS target, as well as the percentage who have waited more than 18 weeks, and more than 52 weeks. A system with a higher percentage of patients waiting longer than 18 weeks is frequently missing the referral-to-treatment target.
- The graph can either be looked at using
- Actual values – numbers of people waiting
- Percent – proportion of people waiting out of total waiting list. This is the recommended option as it gives a better picture of how the system is coping with demand
- Hover over the graph to see the values of data points or click onone of the lines within legend to highlight that dataset by month.
- To customise graph on right hand side, use the RTT month (bar chart), Value Type (bar chart) and Sort bars by filters
- Note that changing these filters will not change the graph on the left hand side
- Click on an organisation to highlight it
Unique filters
- 1) Pathway Type – changes graph and table
a) Complete = patients who have been seen
b) Incomplete = patients who are waiting to be seen - 2) Admission Type – changes graph and table
a) All = admitted and non-admitted
b) Admitted = patients who are admitted to hospital for treatment
c) Non-admitted = patients who are treated in an outpatient setting - 3) Date Type
a) Fiscal year = the NHS year, which is April to March
b) Moving Annual Total = a year’s worth of data from the current month - 4) RTT Month – this affects the bar chart on the right of the dashboard. Use to select which month you want to look at.
Key definitions
- Admitted – patients who are admitted to hospital for treatment
- Complete – patients who have been seen
- Fiscal year – the NHS year, which runs from April to March
- Incomplete – patients who are waiting to be seen
- Moving Annual Total – a year’s worth of data from the current month
- Non-admitted – patients who are treated in an outpatient setting
About the data
Consultant-led Referral To Treatment (RTT) waiting times data is an NHS England dataset that monitors the length of time from referral through to elective treatment for both complete and incomplete pathways across a range of services. Monthly RTT waiting times data has been published since March 2007.
Read the data disclaimer.